Countries around the world are pledging to cut their CO2 emissions by big percentages, notably the UK who are setting themselves the most strict targets, and the US who as the second biggest emitter of CO2 globally can make a huge difference by reducing their footprint. Notably absent from this target setting are China, the world's biggest CO2 producers, who are responsible for more than a quarter (28%) of global emissions.
In the context of that, it's tempting to wonder just how much CO2 the Baltic States are responsible for, and how much impact cutting it would really have.
We don't have figures for 2020 emissions yet, so we are using them from 2019. We will circle back and update this post when we have new ones later this year.
Between them, the Baltic States emitted about 40.7 million tons of CO2 in 2019. While that is a small number compared to many industrial nations, let's put it into some perspective. An average mature tree takes around take around 40 years (or up to 100 years depending on the type of tree) to absorb one ton of CO2, so it would take 40.7 million trees 40 years to offset the emissions produced by Estonia, Latvia and Lithuania in one year.
Let's take a closer look at how each country is doing.
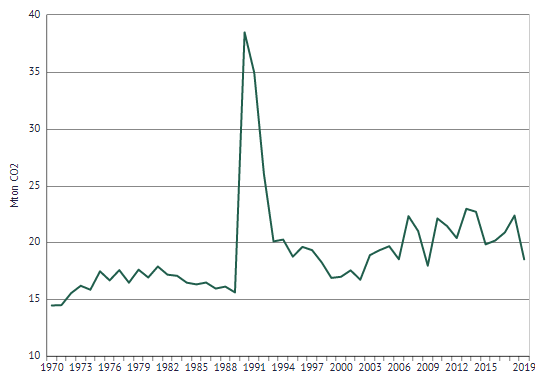
Estonia
Estonia emitted 18.5 million tons of CO2 in 2019, which is about 14.19 tons per capita, more than three times more per capita than either Latvia or Lithuania.
After three years of increases, 2019 saw a drop of 17.22% between 2018 and 2019, down from 22.4 million tons.
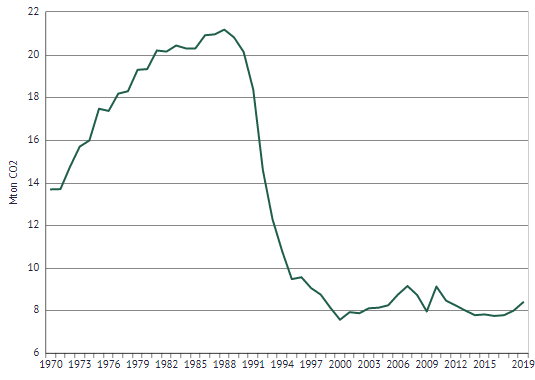
Latvia
Latvia emitted 8.4 million tons of CO2 in 2019, which is about 4.38 tons per capita, the lowest of the three Baltic States.
The worrying thing is that emissions increased 2.73% from 2018, up from 8 million tons.
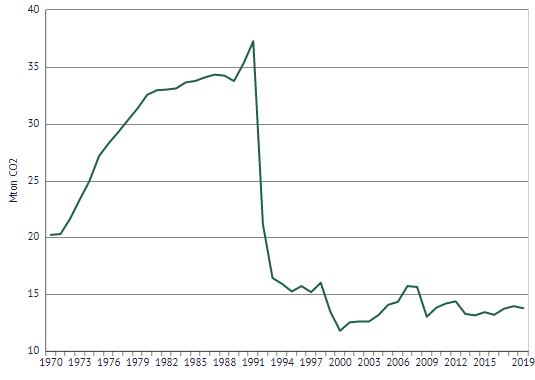
Lithuania
Latvia emitted 13.8 million tons of CO2 in 2019, which is about 4.81 tons per capita.
After a couple of years of increases, Lithuania's emission dropped by 1.23% in 2019, down from 13.9 million tons in 2018
So, the Baltic nations are nowhere near the highest global emitters, either in total or per capita (that would be Qatar), but still that is a lot of carbon dioxide.
Data source: Emissions Database for Global Atmospheric Research
